RISING GLOBAL TRADE PROTECTIONISM: TO WHAT EXTENT CAN SOUTH AFRICA EXPAND ITS AGRICULTURAL TRADE IN ASIA?
By: Bhekani Zondo
Introduction
South Africa’s agricultural trade is currently subject to uncertainty in one of its key markets, the United States (U.S.), following the imposition of a 30% reciprocal tariff by the U.S. government on all commodities destined for this market. Similar to several other countries, South Africa is subject to the U.S. reciprocal tariffs, which are intended to balance bilateral trade deficits between the U.S. and its trading partners. The rising global uncertainty threatening South Africa’s export growth has ignited calls for market diversification. As a member of the World Trade Organization, South Africa has done tremendously in expanding its export footprint, gaining market access to over 181 countries globally. This has largely contributed to the robust export growth of South Africa’s agricultural products over the past three decades.
Market analysis
In 2024, South Africa’s agricultural exports reached a new record of $13.7 billion, recording a year-on-year (y/y) growth rate of 4% from a record $13.2 billion in 2023 (Trade Map, 2025). This is equivalent to a 34% increase over the past five years, from a value of $10.3 billion in 2020. The African continent maintained its position as South Africa’s major export destination for agricultural products with a share of 44% of exports, followed by Asia (21%), the European Union (19%), Middle East (8%), the United Kingdom (UK) (7%), and America’s (6%) with the U.S. specifically accounting for a share of 4%. The Asian aggregation is one of the regions increasingly poised to providing export growth opportunities and cushioning South Africa’s agriculture exports from rising risks of protectionist sentiments in markets like the U.S., especially with fast-growing economies like China offering prospects of liberalization trade to several African countries including South Africa. Therefore, this article aims to analyse South Africa’s agricultural trade performance with the Asian region and outline export opportunities for the key commodities bound to lose market competitiveness in the U.S. market due to the 30% reciprocal tariffs. Figure 4 below illustrates South Africa’s agricultural trade performance with the Asian countries over the past decade.
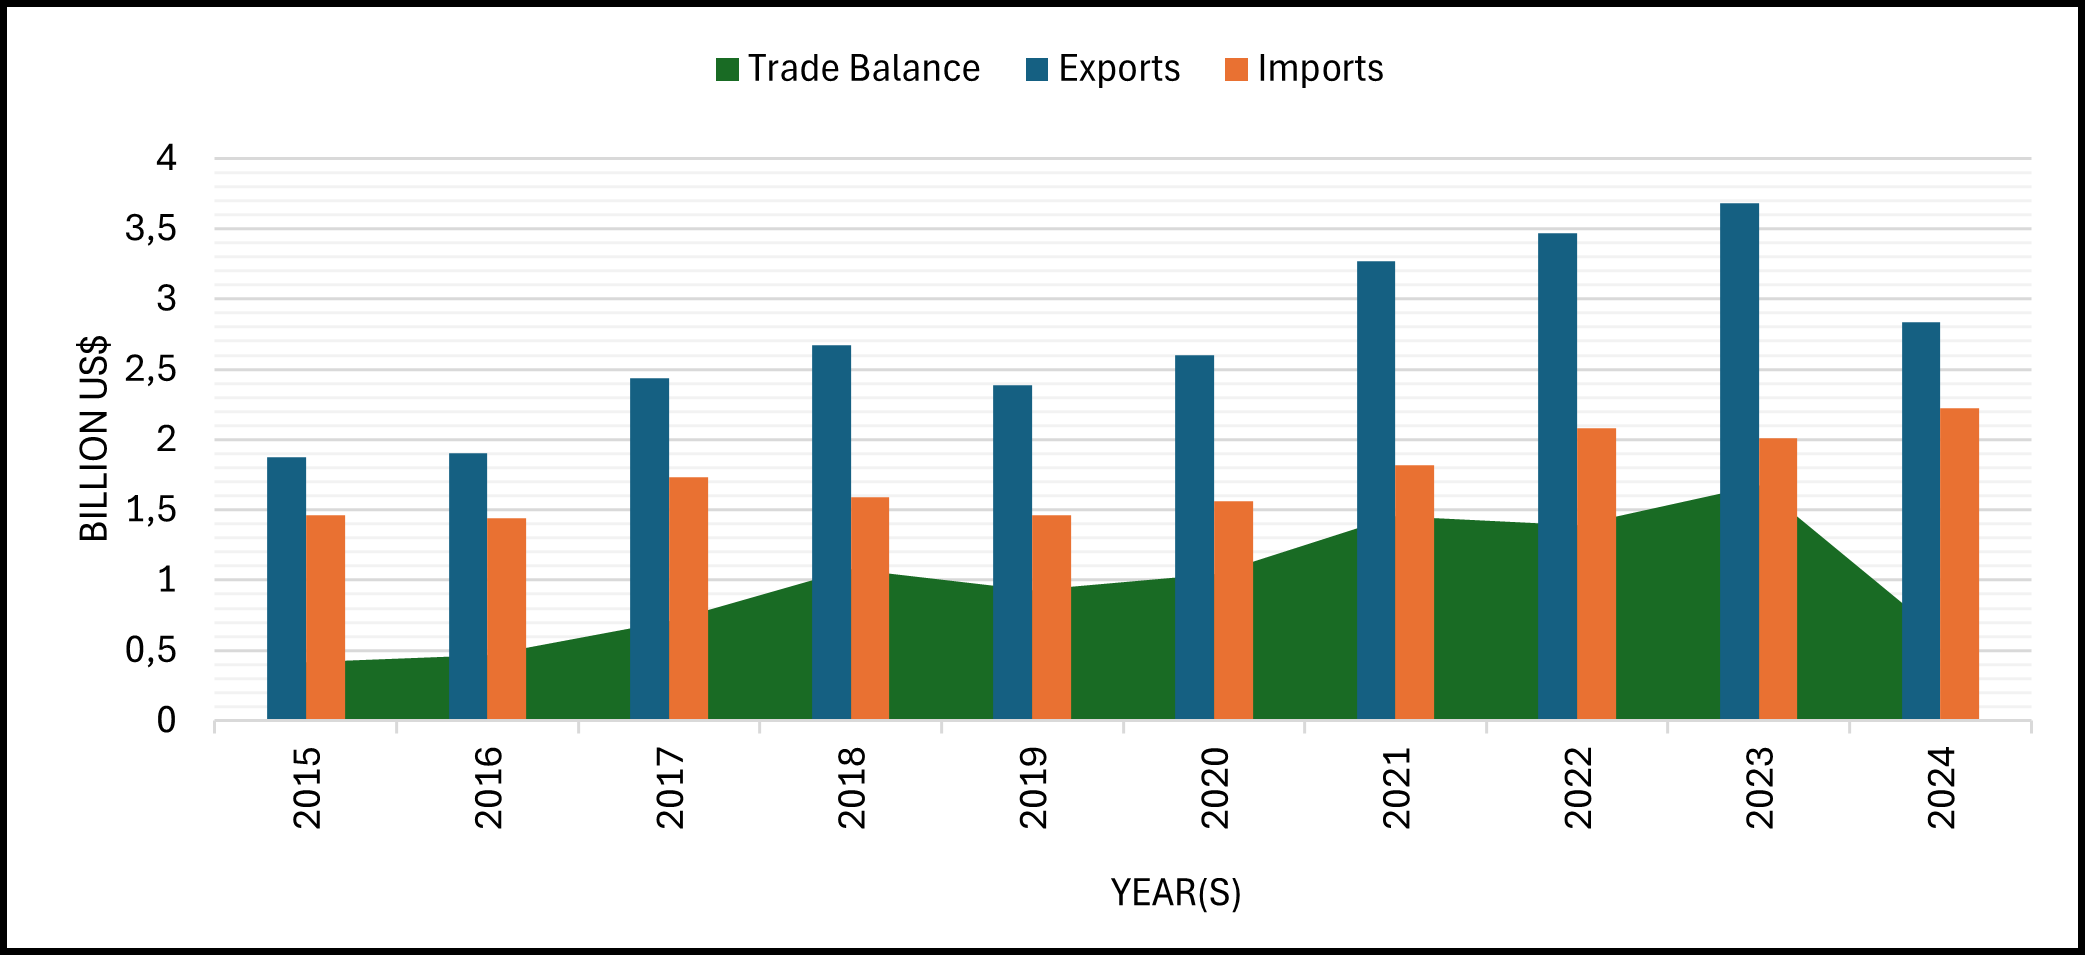
Figure 1: South Africa-Asia agricultural trade performance between 2015 -2024
Source: Trade Map (2025)
South Africa’s agricultural trade with Asia has grown remarkably by over 51% over the past decade, with exports expanding from about US$1.9 billion in 2015 to US$3.7 billion in 2023, although declining to US$2.8 billion in 2024. This steady upward trajectory underscores Asia’s growing importance as a destination for South Africa’s high-value agricultural products. According to trade statistics from International Trade Centre Trade Map (Trade Map, 2025), in 2024, oranges accounted for the largest share of 11% of exports destined for Asia, followed by apples (9%), wool (7%), soft citrus (i.e., mandarins, tangerines, etc.) (6%), nuts (5%), macadamia nuts (5%), raw cane sugar (4%), among others. Whereas the leading export destinations were China, accounting for a share of 26% of South Africa’s agricultural exports to Asia followed by the United Arab Emirates (19%), Malaysia (7%), Saudi Arabia (6%), Japan (4%), and India (4%), among others.
Despite the observed growth in South Africa’s agricultural exports, imports have also increased drastically by approximately 50%, from a value of US$1.5 billion in 2015 to US$2.2 billion in 2024. The leading products sourced from Asia are rice (28%), palm oil (22%), apple juice (4%), animal offal’s (4%), nicotine products (3%), and palm kernels (2%), among others (Trade Map, 2025). On the other hand, Thailand is currently the leading source market for South Africa’s agricultural imports from this region with a share of 24% in value terms, followed by China (23%), Indonesia (18%), India (13%), and Malaysia (11%), among others. Although imports from Asia have surged, the robust export growth has ensured a positive trade balance between South Africa and Asian countries. Agricultural trade balance increased by 47% from approximately US$417 million to US$611 million during the period under consideration.
Figure 5 depicts potential export opportunities for South Africa’s agricultural products, distinguishing between baseline exports (actual exports) and unrealised export potential (untapped export opportunities) in Asia. The analysis considers the top ten agricultural products that are likely to lose market share in the U.S.; these are oranges, soft citrus, wine, macadamia nuts, ice cream, table grapes, raw cane sugar, apple juice, dried fruits, and raisins.
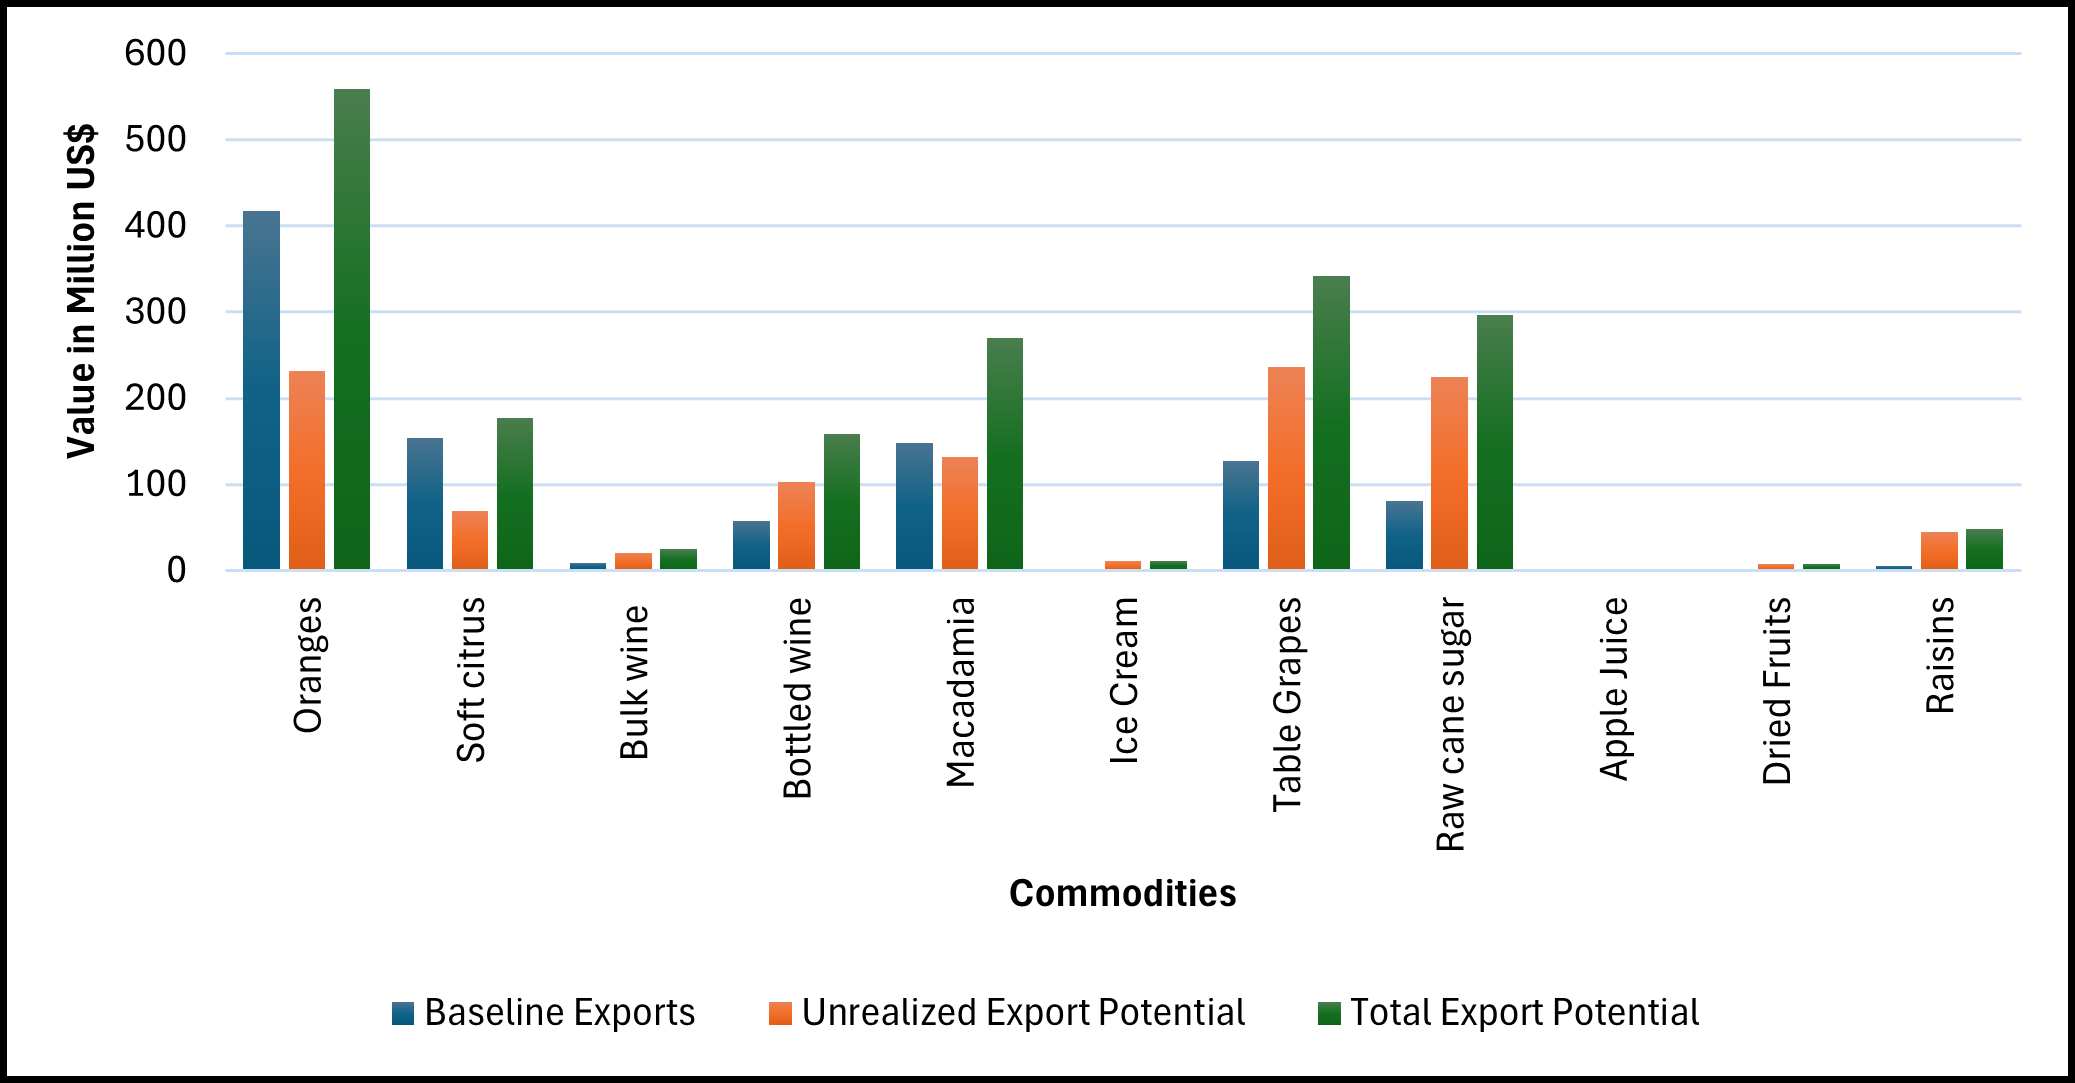
Figure 2: Potential export opportunities for South African agricultural products in Asia
Source: Market Access Map (2025)
The results shows that South Africa has managed to penetrate the Asian markets for commodities such as soft citrus, macadamia nuts, and oranges, with actual exports accounting for over half of the total export potential to this region. South Africa’s export of oranges to the Asian region possesses an export potential worth a value of US$559 million with an unrealized export potential of US$231 million. Table grapes currently lead with the highest unrealized export potential worth US$236 million followed by raw cane sugar (US$225 million), macadamia nuts (US$131 million), bottled wine (US$103 million), and soft citrus (US$69 million). Other commodities with notable unrealized export potential although relatively lower, are raisins (US$44 million), bulk wine (US$22 million), ice cream (US$11 million), dried fruits (US$7.1 million), and apple juice (US$645 000).
Conclusion
South Africa’s agricultural trade prospects in Asia present a significant opportunity to diversify exports and mitigate the risks posed by rising global protectionism. The region’s fast-growing economies, expanding consumer base, and appetite for high-value agricultural products create a lucrative market for South Africa to expand its share and unlock substantial unrealized export potential. This calls for strengthening trade relations with key growing economies such as China, the UAE, Malaysia, and India. Key priority commodities for strategic market diversification include oranges, table grapes, macadamia nuts, raw cane sugar, soft citrus, and wine, which present high unrealized export potential. Lastly, successful market diversification efforts will involve intensifying trade negotiations around the hefty tariffs and non-tariff barriers, which are mainly prevalent in these markets.
INSIGHTS