
SOUTH AFRICA’S AGRICULTURAL TRADE CONTINUED TO EXPAND IN THE SECOND QUARTER OF 2026
Key highlights
- South Africa’s agricultural exports increased by 11% year-on-year in Q2 2026, reaching approximately US$4.08 billion.
- Agricultural imports increased by 12% year-on-year to approximately US$2.01 billion, resulting in a trade surplus of about US$2.08 billion.
- Lemons were the leading export commodity, accounting for 11% of exports, followed by fresh apples (7%), maize (6%) and mandarins (5%).
- Africa remained South Africa’s largest regional export market, accounting for 39% of agricultural exports, followed by Asia and the Middle East (24%) and the European Union (21%).
- The Asia and Middle East region recorded the strongest export growth at 26% year-on-year, while exports to the United States declined by 23%.
South Africa’s agricultural trade continued to expand in the second quarter of 2026, building on record agricultural exports of US$15.1 billion in 2025. Figure 1 illustrates South Africa’s quarterly agricultural trade performance since 2021. In Q2 2026, exports rose by 11% year-on-year to approximately US$4.08 billion (approximately R69.9 billion), supported by strong shipments of lemons, apples, maize and other high-value products. Imports increased by 12% to about US$2.01 billion, leaving the country with an agricultural trade surplus of approximately US$2.08 billion. Compared to Q1 of 2026, this reflects an increase of approximately 10%. On the other hand, imports increased by 12% year-on-year (y/y) to a value of approximately US$2 billion. This has resulted in a 9% expansion in overall agricultural trade balance from US$1.7 billion in Q1 2026.
This performance reflects continued collaboration between government and industry to retain established markets, open new opportunities and meet export requirements, including pre-export controls and sanitary and phytosanitary measures.
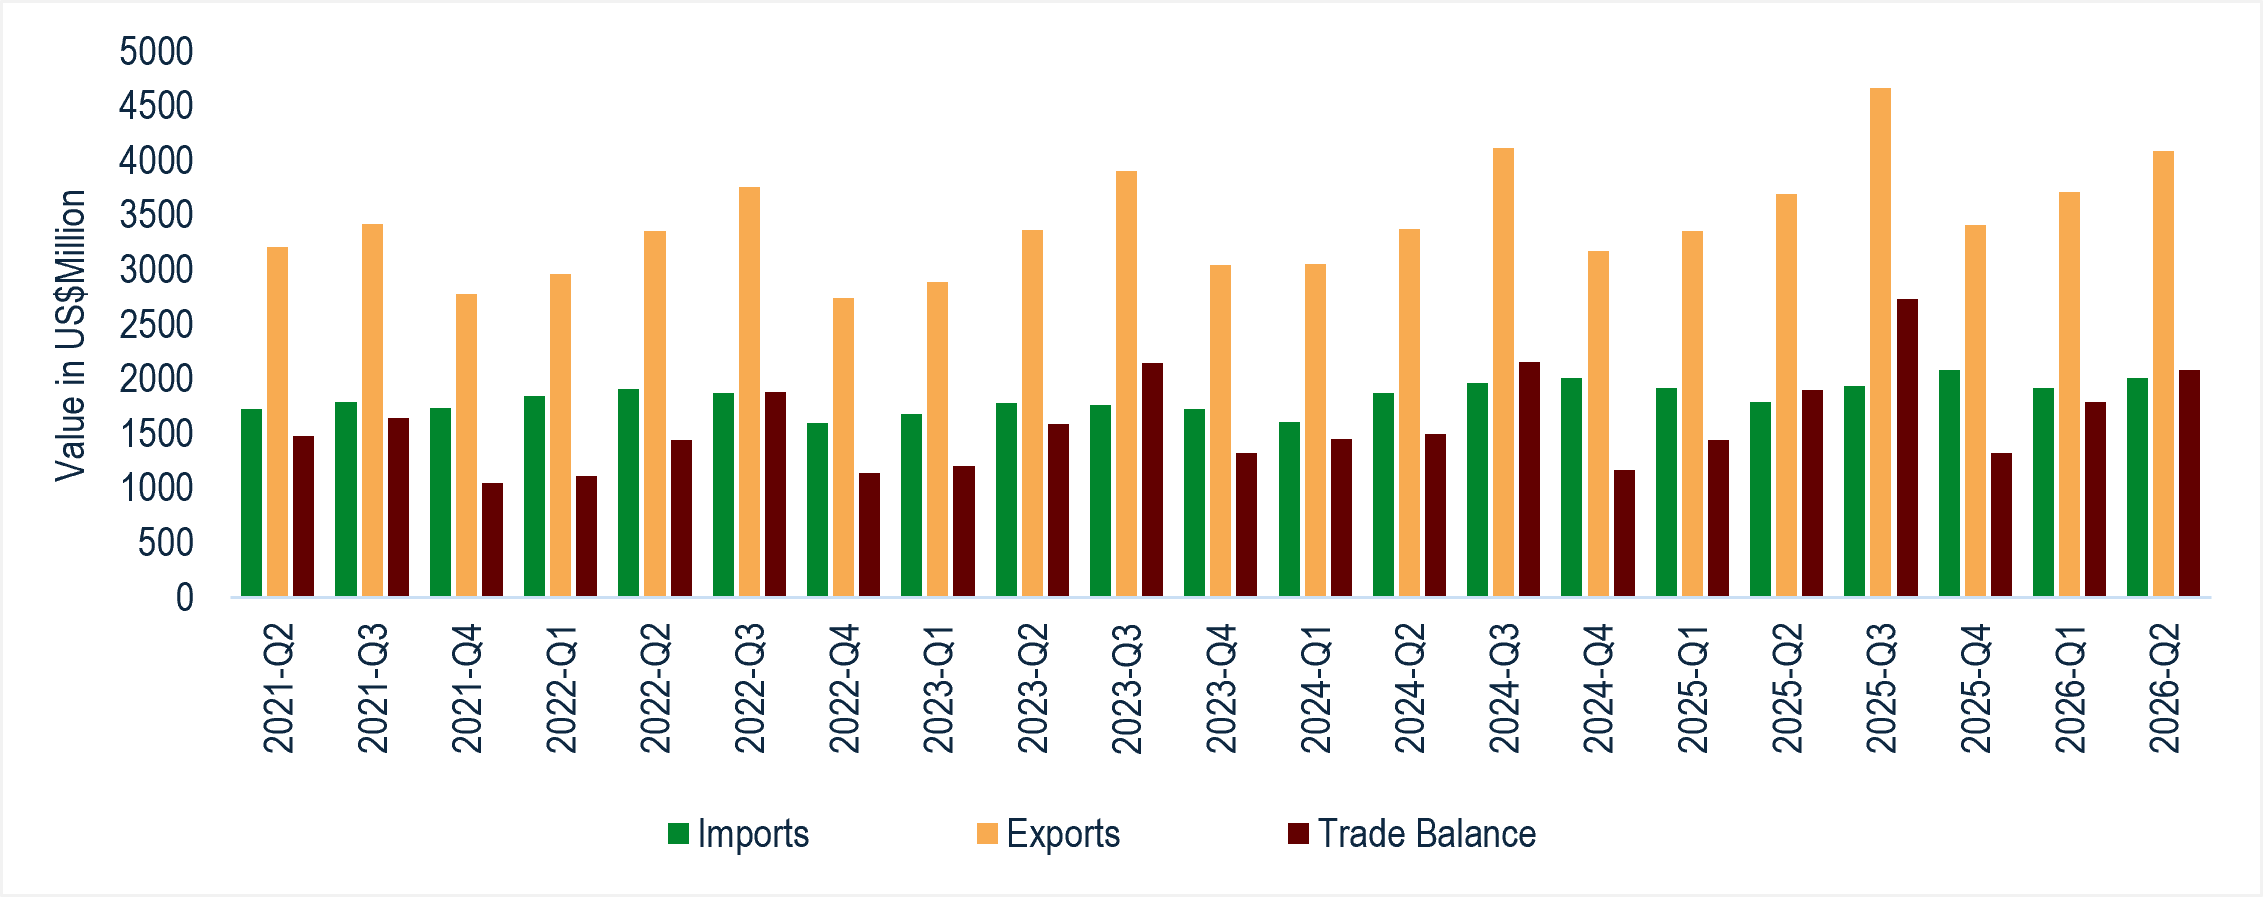
Figure 1: South Africa’s quarterly agricultural products trade performance from 2021-2026
Source: Trade Map (2026)
As of Q2 of 2026, Netherlands was the main export destination for South Africa’s agricultural exports accounting for a share of approximately 11% of total value of exports, followed by Zimbabwe (7%), the United Kingdom (UK) (7%), China (6%), Namibia (5%), Mozambique (5%), and Botswana (5%), among others. On the other hand, in terms of agricultural imports, Thailand was the leading source of agricultural imports with a share of 7%, followed by Eswatini (7%), Indonesia (6%), China (6%), Brazil (5%), and France (5%), among others.
Figure 2 shows the regional distribution of South Africa’s agricultural exports as of Q2 2026. Africa remained the largest export destination, accounting for about 39% of total agricultural exports (worth approximately US$1.61 billion) in Q2 2026, followed by Asia and Middle East (24%), European Union (EU) at 21%, the UK (7%), the Americas (5%), and the United States of America (USA) (3%). The Asia and Middle East region recorded the highest y/y growth of 26% followed by Africa (11%), EU (7%), and the UK (5%), respectively. On the other hand, South Africa’s export to the USA contracted by 23% y/y despite recorded quarterly growth of 56% between Q1 and Q2 2026. This subsequently contributed to a 15% annual contraction of agricultural exports to the Americas region.
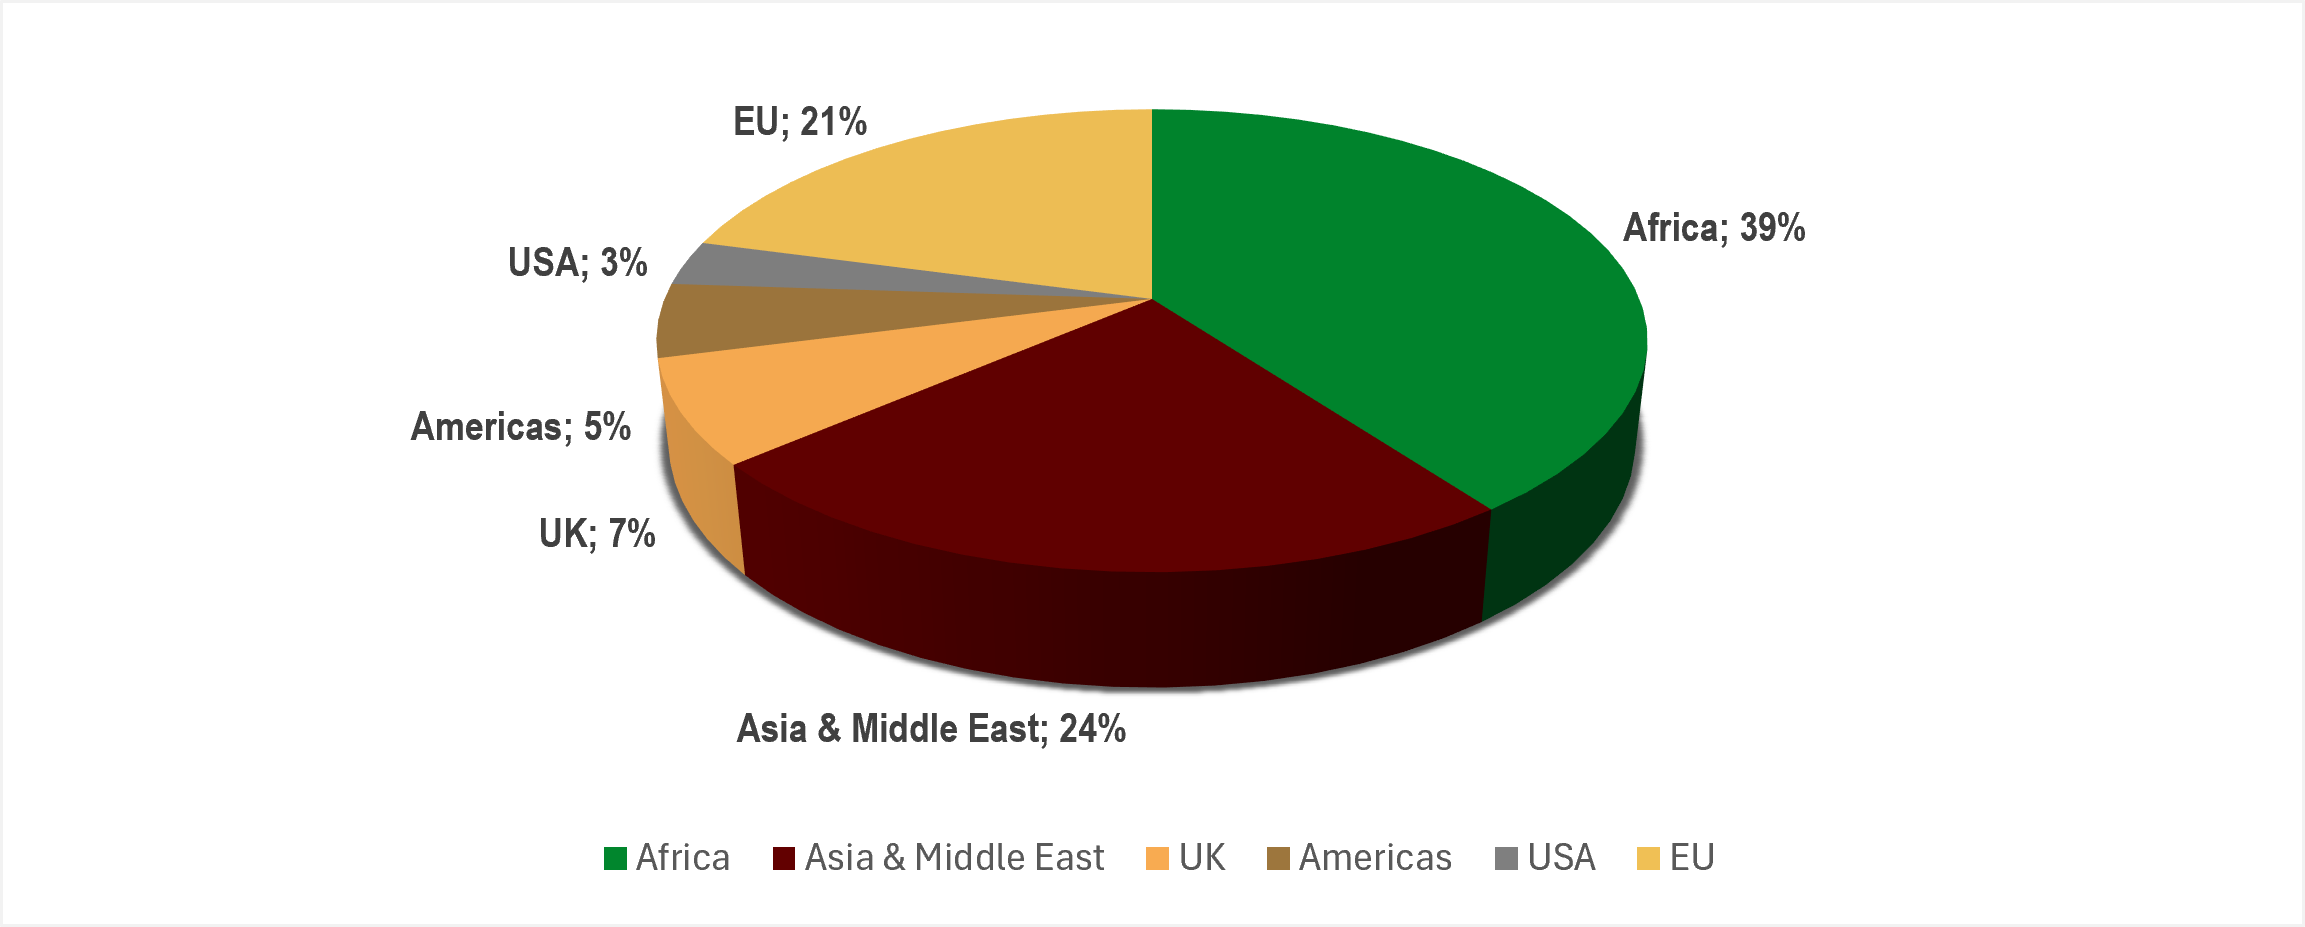
Figure 2: South Africa’s quarterly agricultural trade performance by region in Q2 2026.
Source: Trade Map (2026)
Table 1 illustrate the top 15 agricultural export and import products traded by South Africa between Quarter 2 (Q2) of 2025 and Q2 2026 in value terms. During this period, lemons were the most exported agricultural commodity, accounting for 11% of total exports, followed by apples (7%), maize (6%), and mandarins (5%), among others. Compared with the same period last year, SA’s agricultural exports grew by approximately 11% to US$4.09 billion, with commodities such as cigarettes realising 89% growth, followed by lemons (73%), maize (44%), wool (40%), flavoured water (26%), and preparations for sauces & prepared sauces (24%), respectively. In contrast, the exports of oranges, pears, mandarins, and wine all recorded decreases of 31%, 17%, 4%, and 1% in value terms, respectively.
Table 1: South Africa’s quarterly agricultural products trade performance by region between 2025-Q2 and 2026-Q2
| 2025-Q2 | 2026-Q2 | Y/Y | %Share | 2025-Q2 | 2026-Q2 | Y/Y | %Share | |||
| Exports (US$’000) | Imports (US$’000) | |||||||||
| Total Exports | 3 692 885 | 4 085 972 | 11% | – | Total Imports | 1 791 208 | 2 007 277 | 12% | – | |
| Lemons | 248934 | 431663 | 73% | 11% | Semi-milled or wholly milled rice | 125640 | 154491 | 23% | 8% | |
| Fresh apples | 266562 | 294750 | 11% | 7% | Wheat and meslin | 170186 | 139538 | -18% | 7% | |
| Maize (excl. seed for sowing) | 168958 | 242814 | 44% | 6% | Palm oil | 134783 | 131403 | -3% | 7% | |
| Fresh or dried mandarins (excl. clementines) | 232342 | 222664 | -4% | 5% | Raw cane sugar, in solid form | 63755 | 76974 | 21% | 4% | |
| Wine | 115599 | 114050 | -1% | 3% | Food preparations, n.e.s. | 59955 | 67647 | 13% | 3% | |
| Wool | 74020 | 103749 | 40% | 3% | Flavoured water | 35580 | 53846 | 51% | 3% | |
| Fresh or dried oranges | 149239 | 103630 | -31% | 3% | Coffee (excl. roasted and decaffeinated) | 31984 | 45268 | 42% | 2% | |
| Fresh or dried grapefruit and pomelos | 88253 | 95100 | 8% | 2% | Whiskies | 35064 | 43410 | 24% | 2% | |
| Fresh or dried avocados | 81111 | 90176 | 11% | 2% | Cane or beet sugar and chemically pure sucrose, in solid form | 38187 | 40726 | 7% | 2% | |
| Fresh pears | 95460 | 79548 | -17% | 2% | Preparations of a kind used in animal feeding (excl. dog or cat food put up for retail sale) | 28075 | 36545 | 30% | 2% | |
| Flavoured water | 52118 | 65768 | 26% | 2% | Crude sunflower-seed or safflower oil | 126 | 35785 | 28301% | 2% | |
| Dried grapes | 59635 | 63180 | 6% | 2% | Frozen fowls of the species Gallus domesticus, not cut in pieces | 27011 | 35049 | 30% | 2% | |
| Cigarettes, containing tobacco | 31919 | 60304 | 89% | 1% | Coffee extracts | 38296 | 34902 | -9% | 2% | |
| Preparations for sauces and prepared sauces | 48317 | 59861 | 24% | 1% | Tobacco, partly or wholly stemmed or stripped, otherwise unmanufactured | 21090 | 32910 | 56% | 2% | |
| Food preparations, n.e.s. | 56869 | 58252 | 2% | 1% | Spirits obtained by distilling grape wine or grape marc | 26538 | 32050 | 21% | 2% | |
Source: Trade Map (2026)
In terms of agricultural imports, most commodities increased between Q2 2025 and Q2 2026, with only three of which recorded considerable declines. During this period, the commodities that made up most of total imports were semi-milled or wholly milled rice which accounted for a significant share of 8%, followed by wheat & meslin and palm oil each with a 7% share, and raw cane in solid form (4%), among others. Although wheat & meslin and palm oil accounted for larger shares in country’s agricultural imports, their imports relatively dropped by 18% and 3%, year-on year, while coffee extract also fell by 9%. However, the decline in imports of these commodities could not offset the increase in imports of other commodities, which resulted in the country’s overall agricultural imports increasing by 12% year-on-year. The imports of crude sunflower seed increased by over 100% compared to the same quarter as last year, increasing from US$0.126 million to US$35.8 million, followed by tobacco (56%), flavoured water (51%), and coffee (42%), respectively.
In conclusion, South Africa’s agricultural trade remained resilient in Q2 2026. Exports increased by 11% year-on-year to approximately US$4.09 billion, while imports rose by 12% to about US$2.01 billion, resulting in a trade surplus of roughly US$2.08 billion. Export performance was led by lemons, fresh apples, maize and mandarins, with particularly strong growth in cigarettes, lemons, maize and wool. Africa remained the largest regional market, while Asia and the Middle East recorded the strongest year-on-year growth. However, the decline in exports to the United States highlights the importance of maintaining established markets, diversifying export destinations and continuing collaboration between government and industry to strengthen market access and export competitiveness.
Enquiries:
Dr Victor Thindisa
Senior Manager: Markets and Economic Research Centre
National Agricultural marketing Council
BELOW IS THE FULL COMMENTARY ON THE SOUTH AFRICA’S AGRICULTURAL TRADE PERFORMANCE IN Q2 2026