SOUTH AFRICA’S AGRICULTURAL TRADE PERFORMANCE REMAINED POSITIVE IN Q1 2026
Key highlights
- South Africa’s agricultural exports increased by 11% year-on-year in Q1 2026, reaching approximately US$3.71 billion.
- Agricultural imports declined by 3% year-on-year to approximately US$1.86 billion, supporting a stronger trade balance.
- Table grapes remained the leading export commodity, while strong growth was recorded for raw cane sugar, soya beans, lemons, fresh apples and wine.
- Africa remained South Africa’s largest regional export market, accounting for about 44% of total agricultural exports, followed by the EU and Asia & the Middle East.
- Emerging global trade risks, including shipping disruptions, higher logistics costs and tariff-related pressures, may affect export competitiveness, particularly for perishable products.
Over the years, South Africa maintained its robust export growth of agricultural products in international markets reaching a new record of US$15.1 billion in 2025, an increase of about 10% compared to the US$13.7 billion exported in year 2024. South Africa’s continued export growth is largely underscored by collaborative efforts of both government and industry in maintaining good relations with existing markets and opening of new markets. In addition, efforts to adhere to export requirements such as pre-export controls, sanitary and phytosanitary (SPS) requirements among other things have contributed to the sustained export growth of South Africa’s agricultural products. Figure 1 illustrates South Africa’s quarterly agricultural trade performance since year 2021.
As of the first quarter of 2026 (Q1), South Africa’s agricultural trade performance continued its positive trajectory with exports increasing by 11% to a value of US$3.71 billion (approximately R63.6 billion) compared to the same period last year. Compared to Q4 of 2025, this reflects an increase of approximately 9%. On the other hand, imports decreased by 3% year-on-year (y/y) to a value of approximately US$1.8 billion. This has resulted in a 29% expansion in overall agricultural trade balance from US$1.4 billion in Q1 2025.
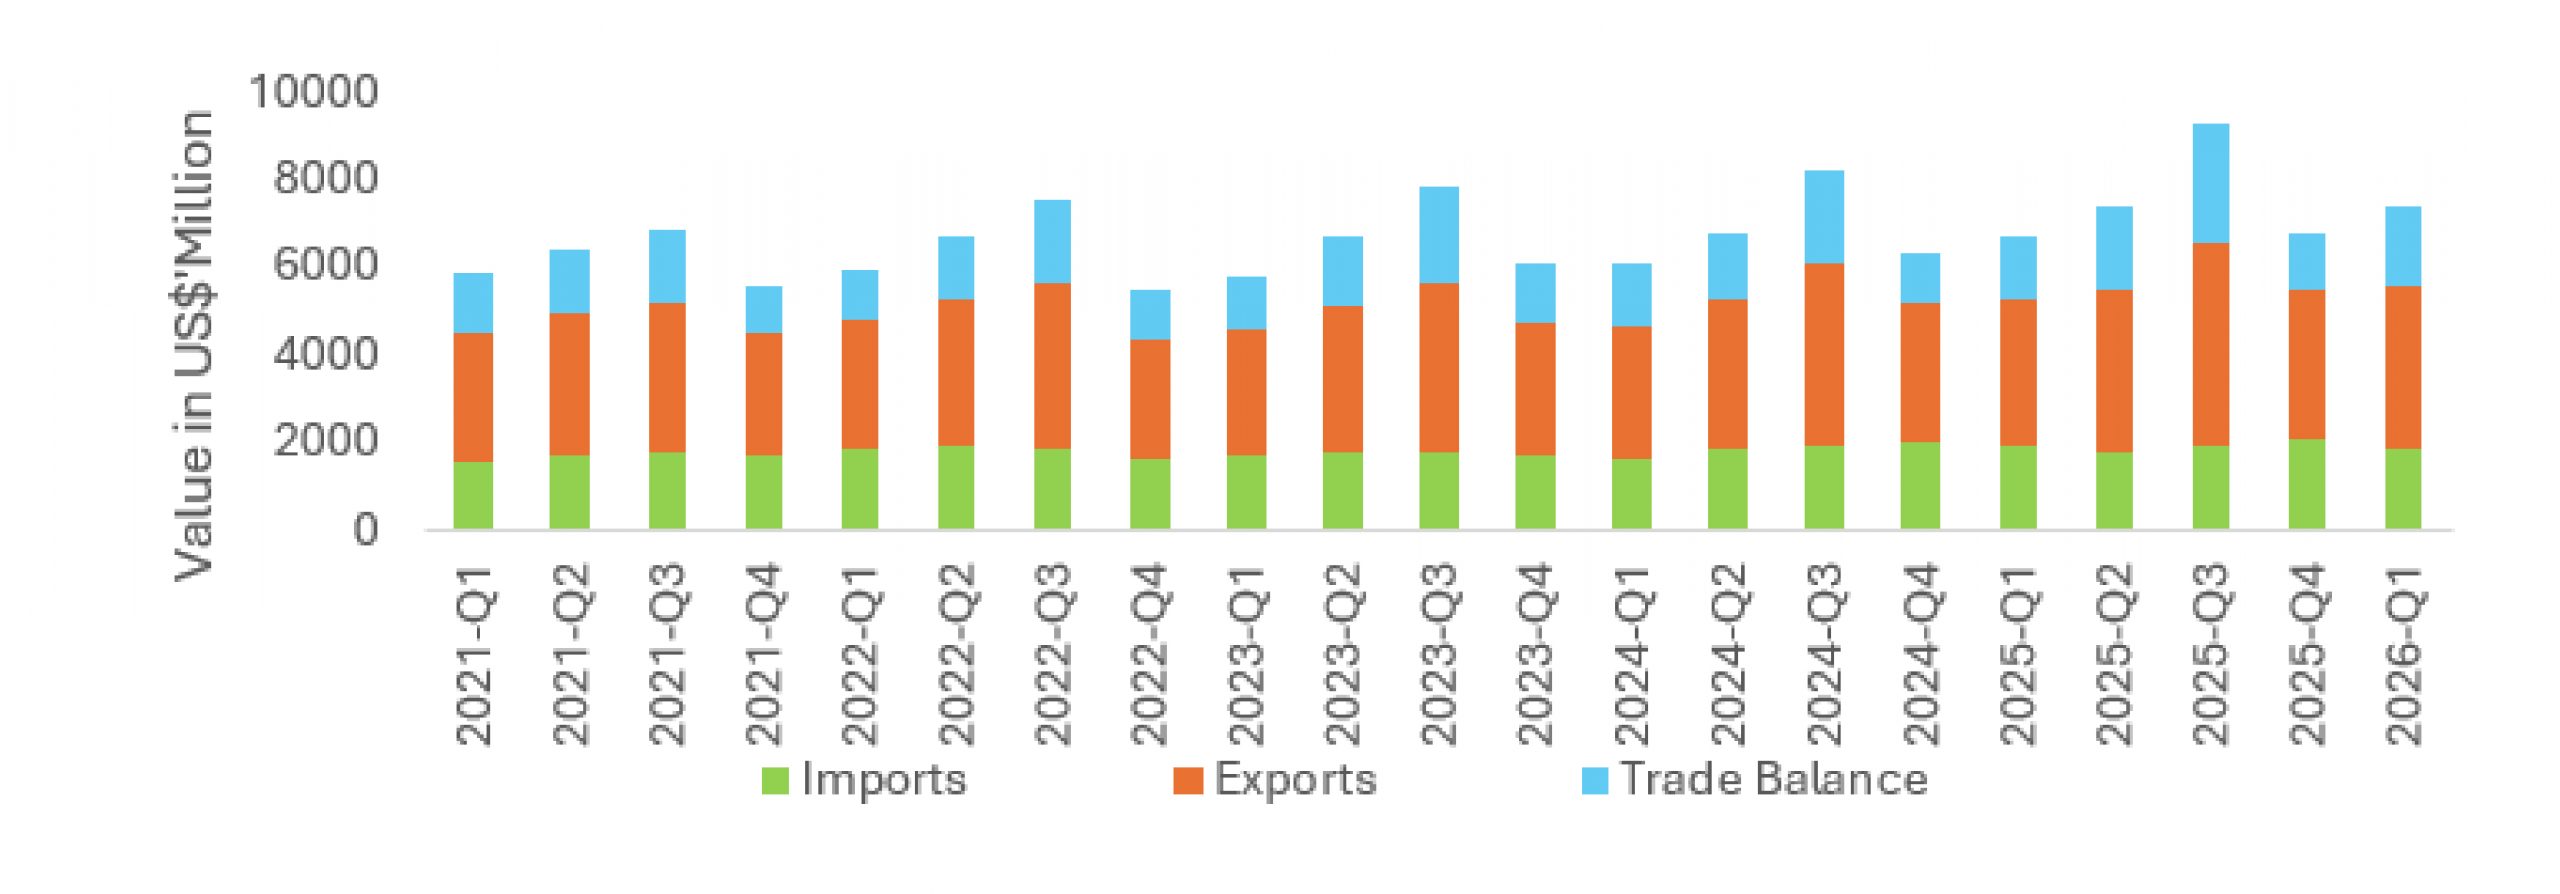
Figure 1: South Africa’s quarterly agricultural products trade performance from 2021-2026
Source: Trade Map (2026)
As of Q1 2026, Netherlands was the main export destination for South Africa’s agricultural exports accounting for a share of approximately 20% of total value of exports, followed by United Kingdom (UK) (9%), Zimbabwe (9%), Namibia (6%), Mozambique (6%), Botswana (6%), among others. On the other hand, in terms of agricultural imports, Eswatini accounted for approximately 8% of the total value of South Africa’s imports followed by Brazil (7%), China (6%), Indonesia (6%), and Thailand (5%), among others.
Figure 2 shows the regional distribution of South Africa’s agricultural exports between Q1 2025 and Q1 2026. Africa remained the largest export destination, accounting for about 44% of total agricultural exports (worth approximately US$1.6 billion) in Q1 2026, followed by the European Union (EU) at 26%, Asia and the Middle East (14%), the UK (9%), the Americas (4%), and the United States of America (USA) (2%). South Africa’s exports to the UK recorded highest year-on-year growth of 30% during this period, followed by the EU (24%), and the African continent (8%). Contrary, exports to the USA recorded the highest year-on-year drop of 33%, followed by Americas (-23%), and Asia & Middle East (-3%).
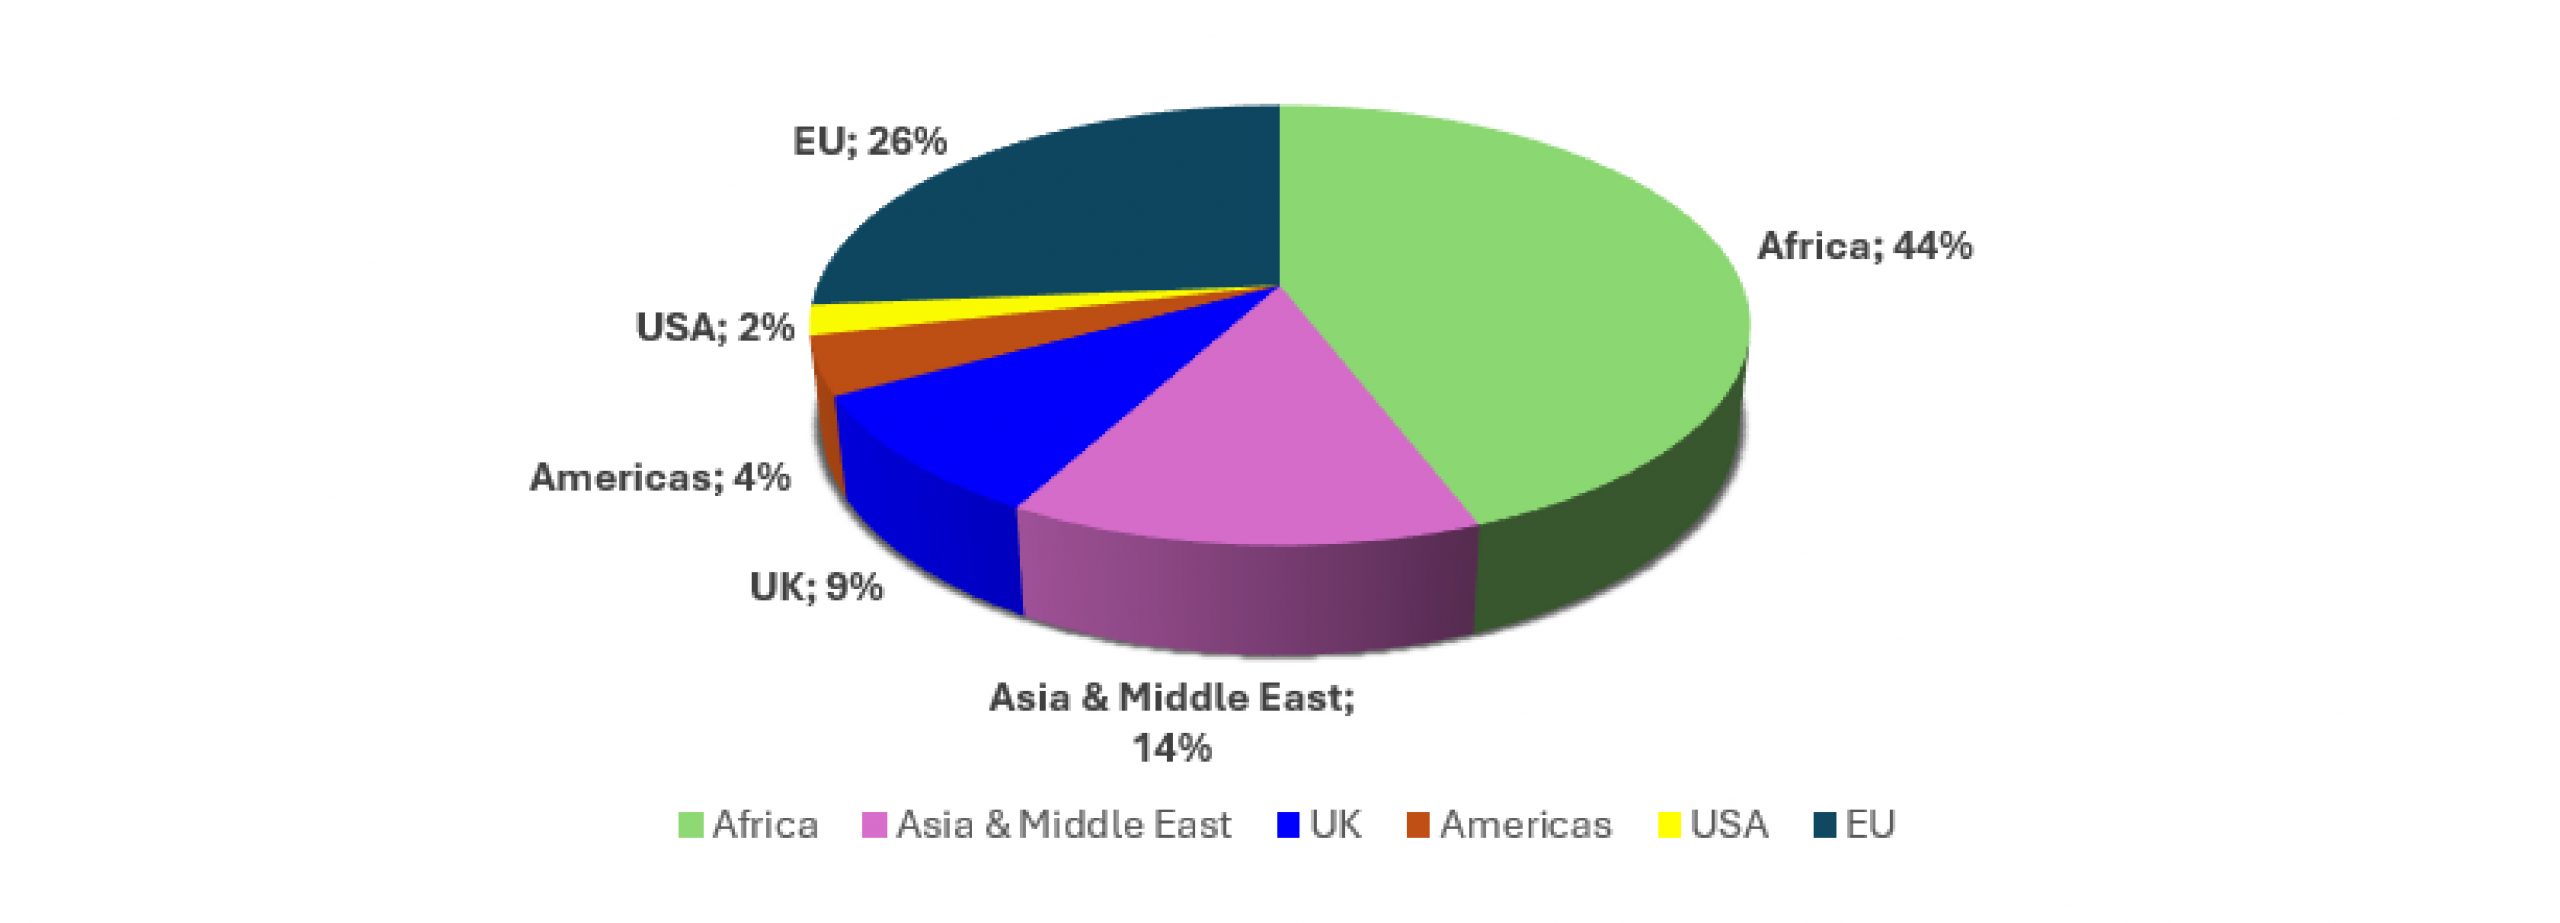
Figure 2: South Africa’s quarterly agricultural trade performance by region in Q1 2026.
Source: Trade Map (2026)
While South Africa is still trying to cope with USA reciprocal tariffs, the USA/Israel-Iran war in the Middle East introduced another layer of uncertainty to global agricultural trade. the conflict has disrupted shipping routes, causing longer transit times and higher shipment costs, and raised concerns over supply chain reliability, along the strait of Hurmuz. These developments are likely to have significant implications for South Africa’s agricultural exports, especially for highly perishable and export-oriented commodities such as citrus, table grapes, deciduous fruit etc, which rely heavily on efficient shipping and timely market access to destinations in the Middle East, Europe, and Asia. Prolonged instability in the region could reduce competitiveness of South African agricultural products in international markets.
Table 1 below presents the top 15 agricultural exports and imports traded by South Africa between Quarter 1 (Q1) of 2025 and Q1 2026 in value terms. During this period, table grapes were the most exported agricultural commodity, accounting for 22% of total exports. This significant share was mainly attributable to a high export peak between January and mid-February. Following this, maize accounted for about 5%, fresh apples for 4%, and fresh plums, wine and pears each for 3%, among others. While the country’s overall agricultural exports grew by 11% yearly, the commodities that contributed to this growth were raw cane sugar in solid form, which realised a significant 479% growth, followed by soya beans (258%), lemons (85%), fresh apples (50%), and wine (32%), respectively. In contrast, although maize recorded a second large share of total exports, it declined by 20%.
Table 1: South Africa’s quarterly agricultural products trade performance by region between 2025-Q1 and 2026-Q1
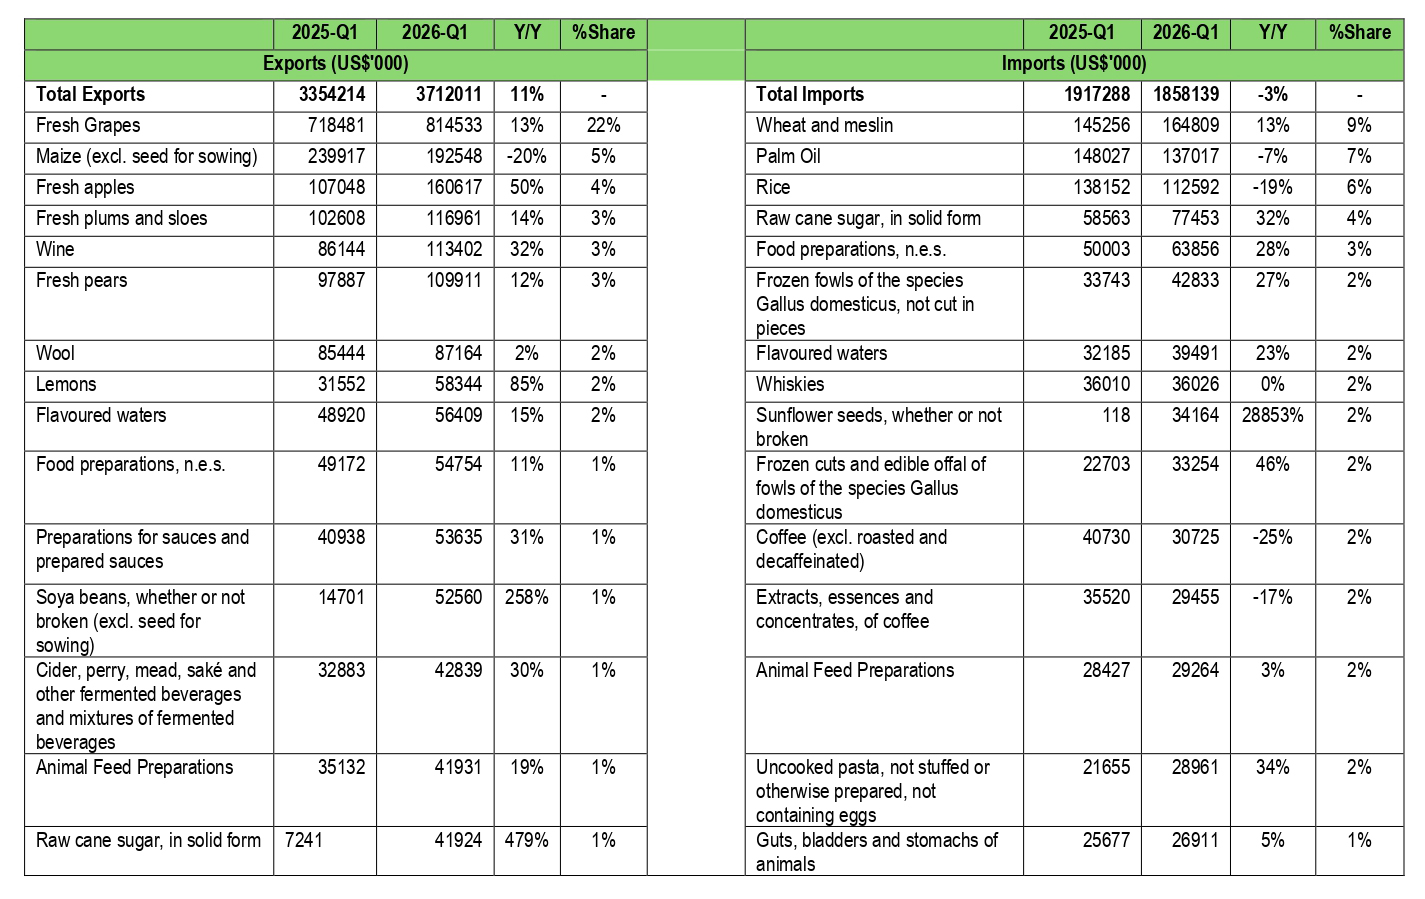
Regarding agricultural imports, most commodities increased between Q1 2025 and Q1 2026, with only a few that recorded considerable declines. During this period, the commodities that made up most of the total imports were wheat and meslin, which together accounted for a significant share of 9%, followed by palm oil (7%), rice (6%), raw cane in solid form (4%), and food preparations (3%), amongst others. Of these commodities, the annual declines in rice (19%) and palm oil (7%) had a significant impact on the country’s overall agricultural imports, which fell by 3%. Similar declines were observed in coffee (25%) and in coffee extracts, essences, and concentrates (17%), respectively. Despite that, commodities such as sunflower seeds, whether or not broken, recorded a significant 28 853% growth in imports, followed by frozen cuts and edible offal of fowls of the species Gallus domesticus (46%), uncooked pasta (34%), and raw cane sugar in solid form (32%), respectively.
In conclusion, South Africa’s agricultural trade performance remained positive in Q1 2026, underpinned by strong export growth and a moderate decline in imports. Agricultural exports increased by 11% year-on-year to approximately US$3.71 billion, while imports declined by 3% to about US$1.86 billion, resulting in an improved trade balance. The export performance was supported by strong growth in key commodities such as table grapes, fresh apples, lemons, wine, soya beans and raw cane sugar, despite a decline in maize exports. On the side of imports, wheat and meslin, palm oil, rice, raw cane sugar and food preparations remained the leading products, while lower imports of rice, palm oil and coffee contributed to the overall decline in the value of imports.
Going forward, sustaining this positive momentum will require continued efforts to expand and diversify market access, strengthen exports compliance, and deepen trade relations in established markets such as Africa, the EU and the UK. At the same time, South Africa should pursue growth opportunities in Asia and the Middle East, while improving logistics resilience to reduce exposure to shipping delays, rising freight costs and disruptions along strategic trade routes. Given the vulnerability of perishable and export-oriented products to global trade uncertainty and tariff-related pressures, sustained collaboration between government and industry will be essential to safeguard competitiveness, preserve export growth and support the long-term expansion of South Africa’s agricultural sector.
Enquiries:
Dr Victor Thindisa
Senior Manager: Markets and Economic Research Centre
National Agricultural marketing Council
Contributions by:
Bhekani Zondo, Simphiwe Mlotshwa, Phelelani Sibiya, Solly Molepo, Victor Thindisa
BELOW IS THE FULL COMMENTARY ON THE SOUTH AFRICA’S AGRICULTURAL TRADE PERFORMANCE REMAINED POSITIVE IN Q1 2026